How am I doing compared to others? Are my results better or worse than my competition’s? What are other companies in my field doing? What do the results of my email marketing campaigns even mean? Well, keep on reading, and you will find answers to all of these, plus some other questions!
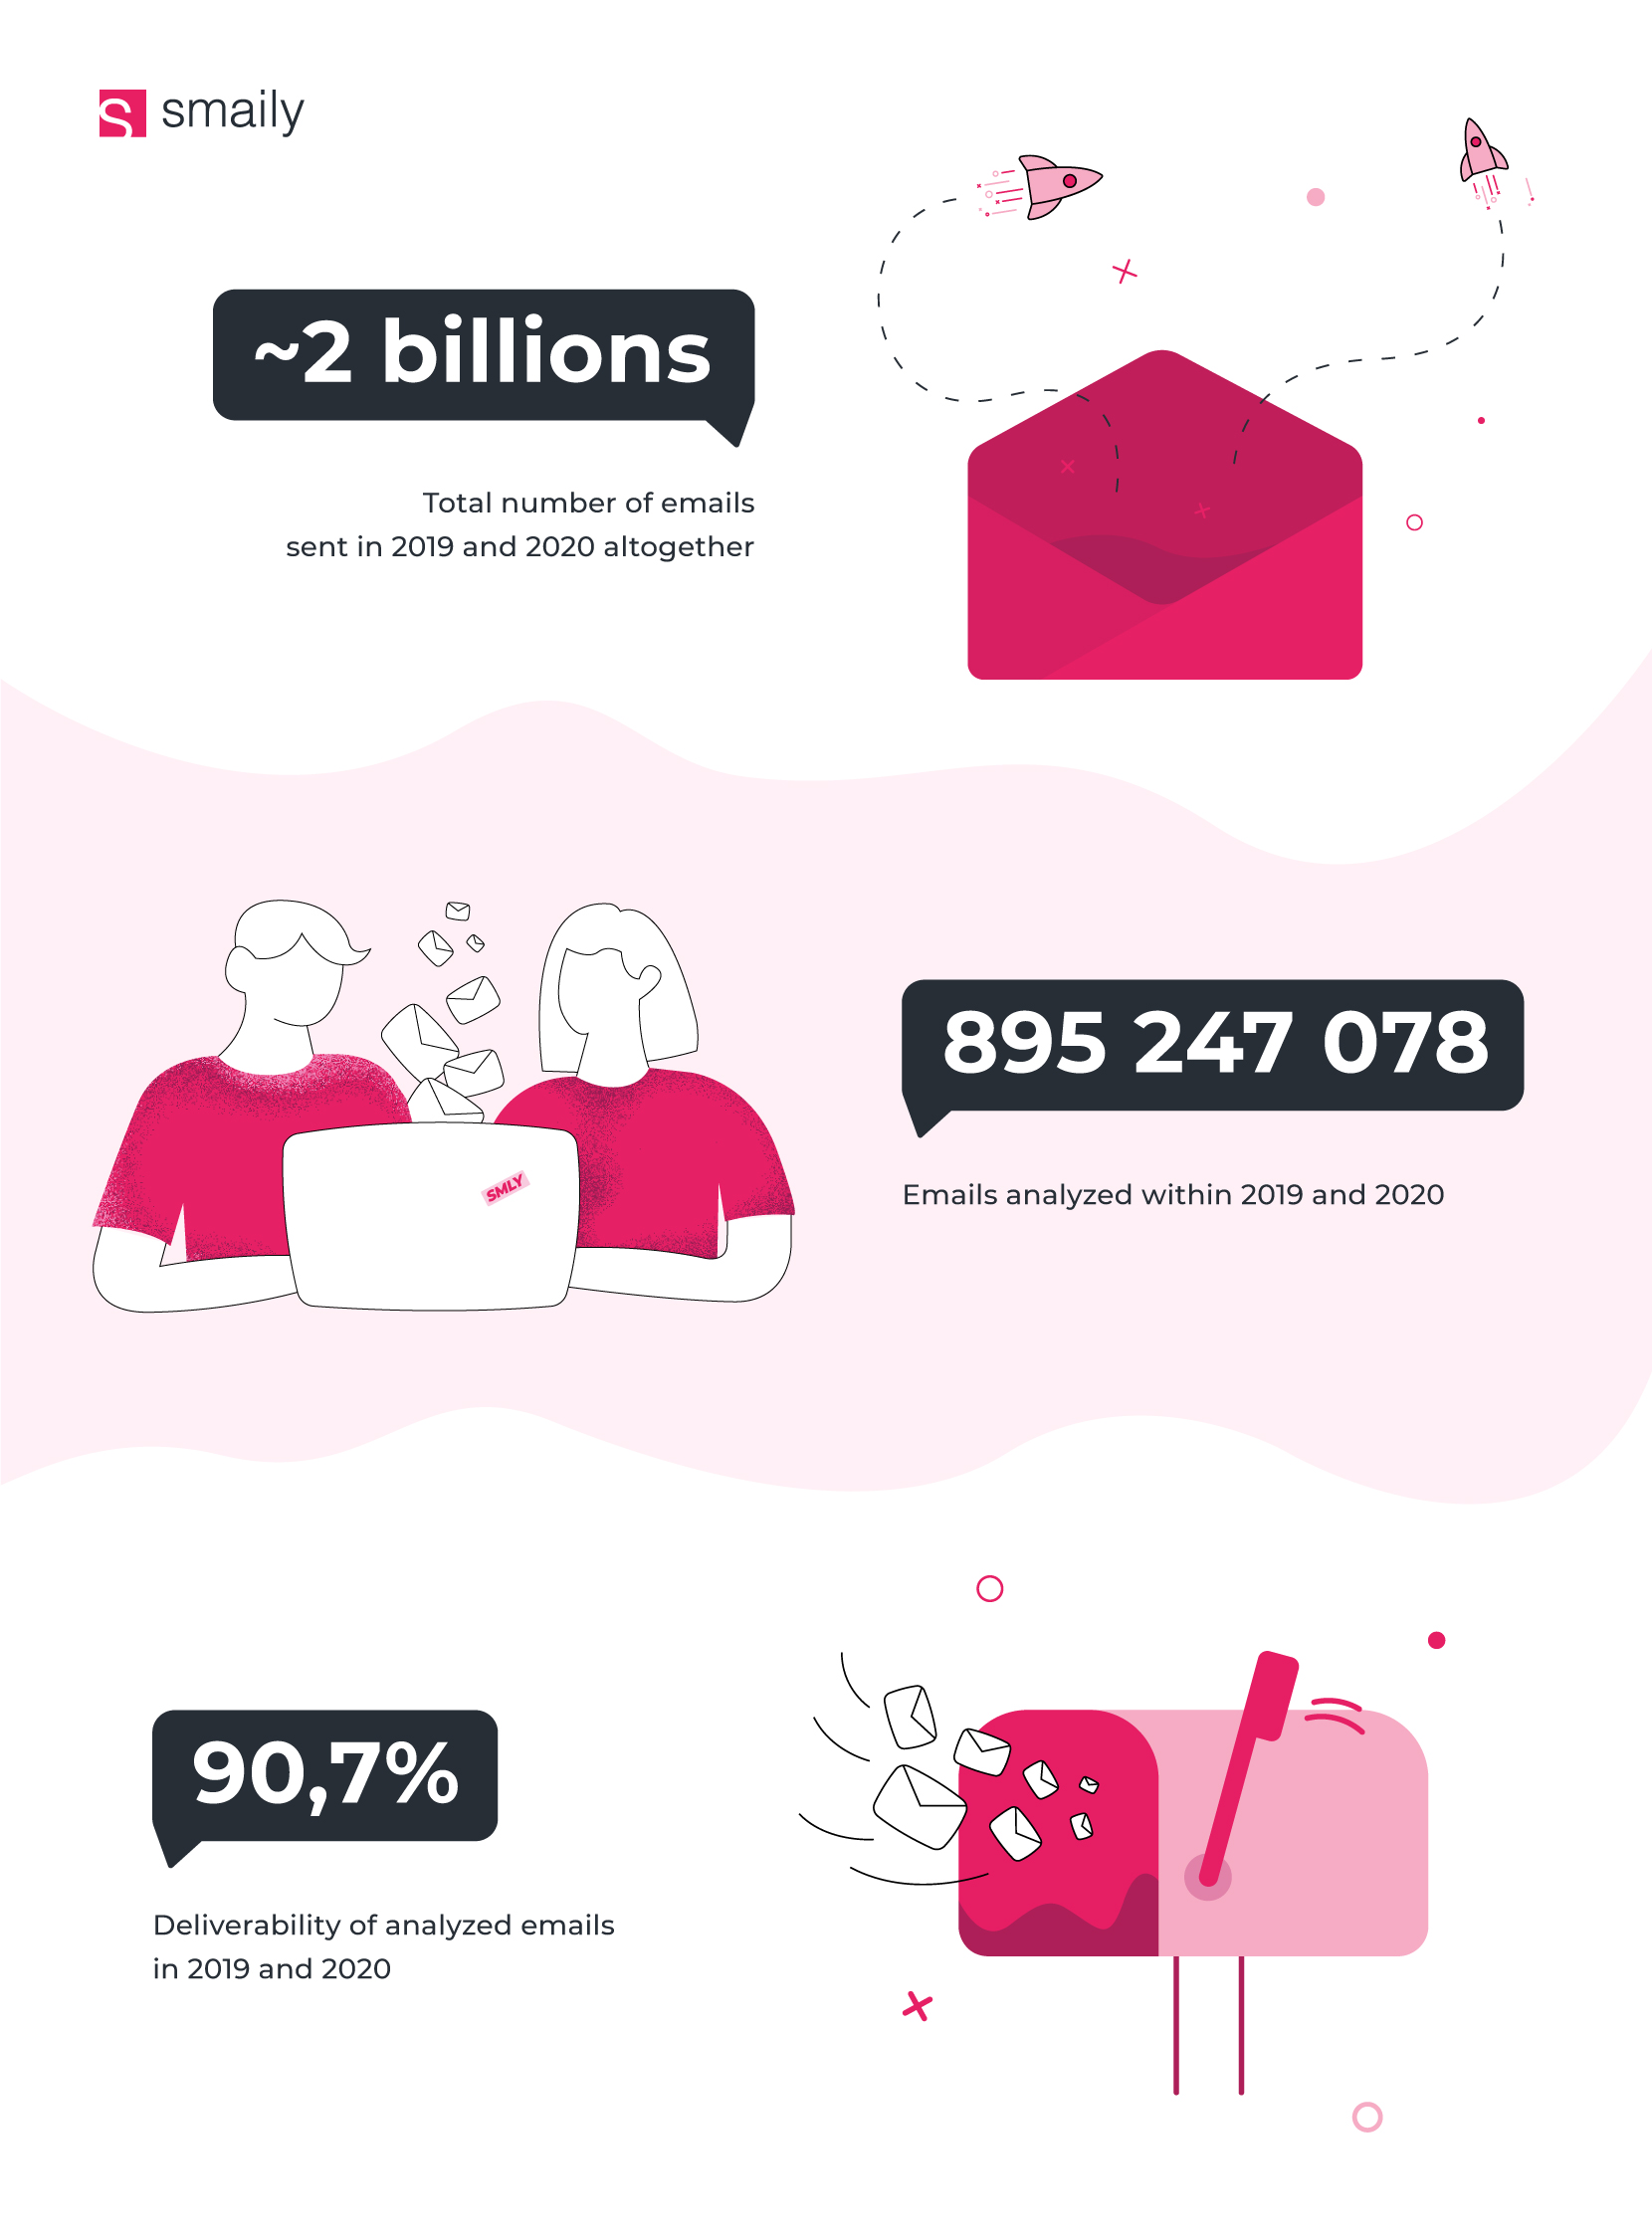
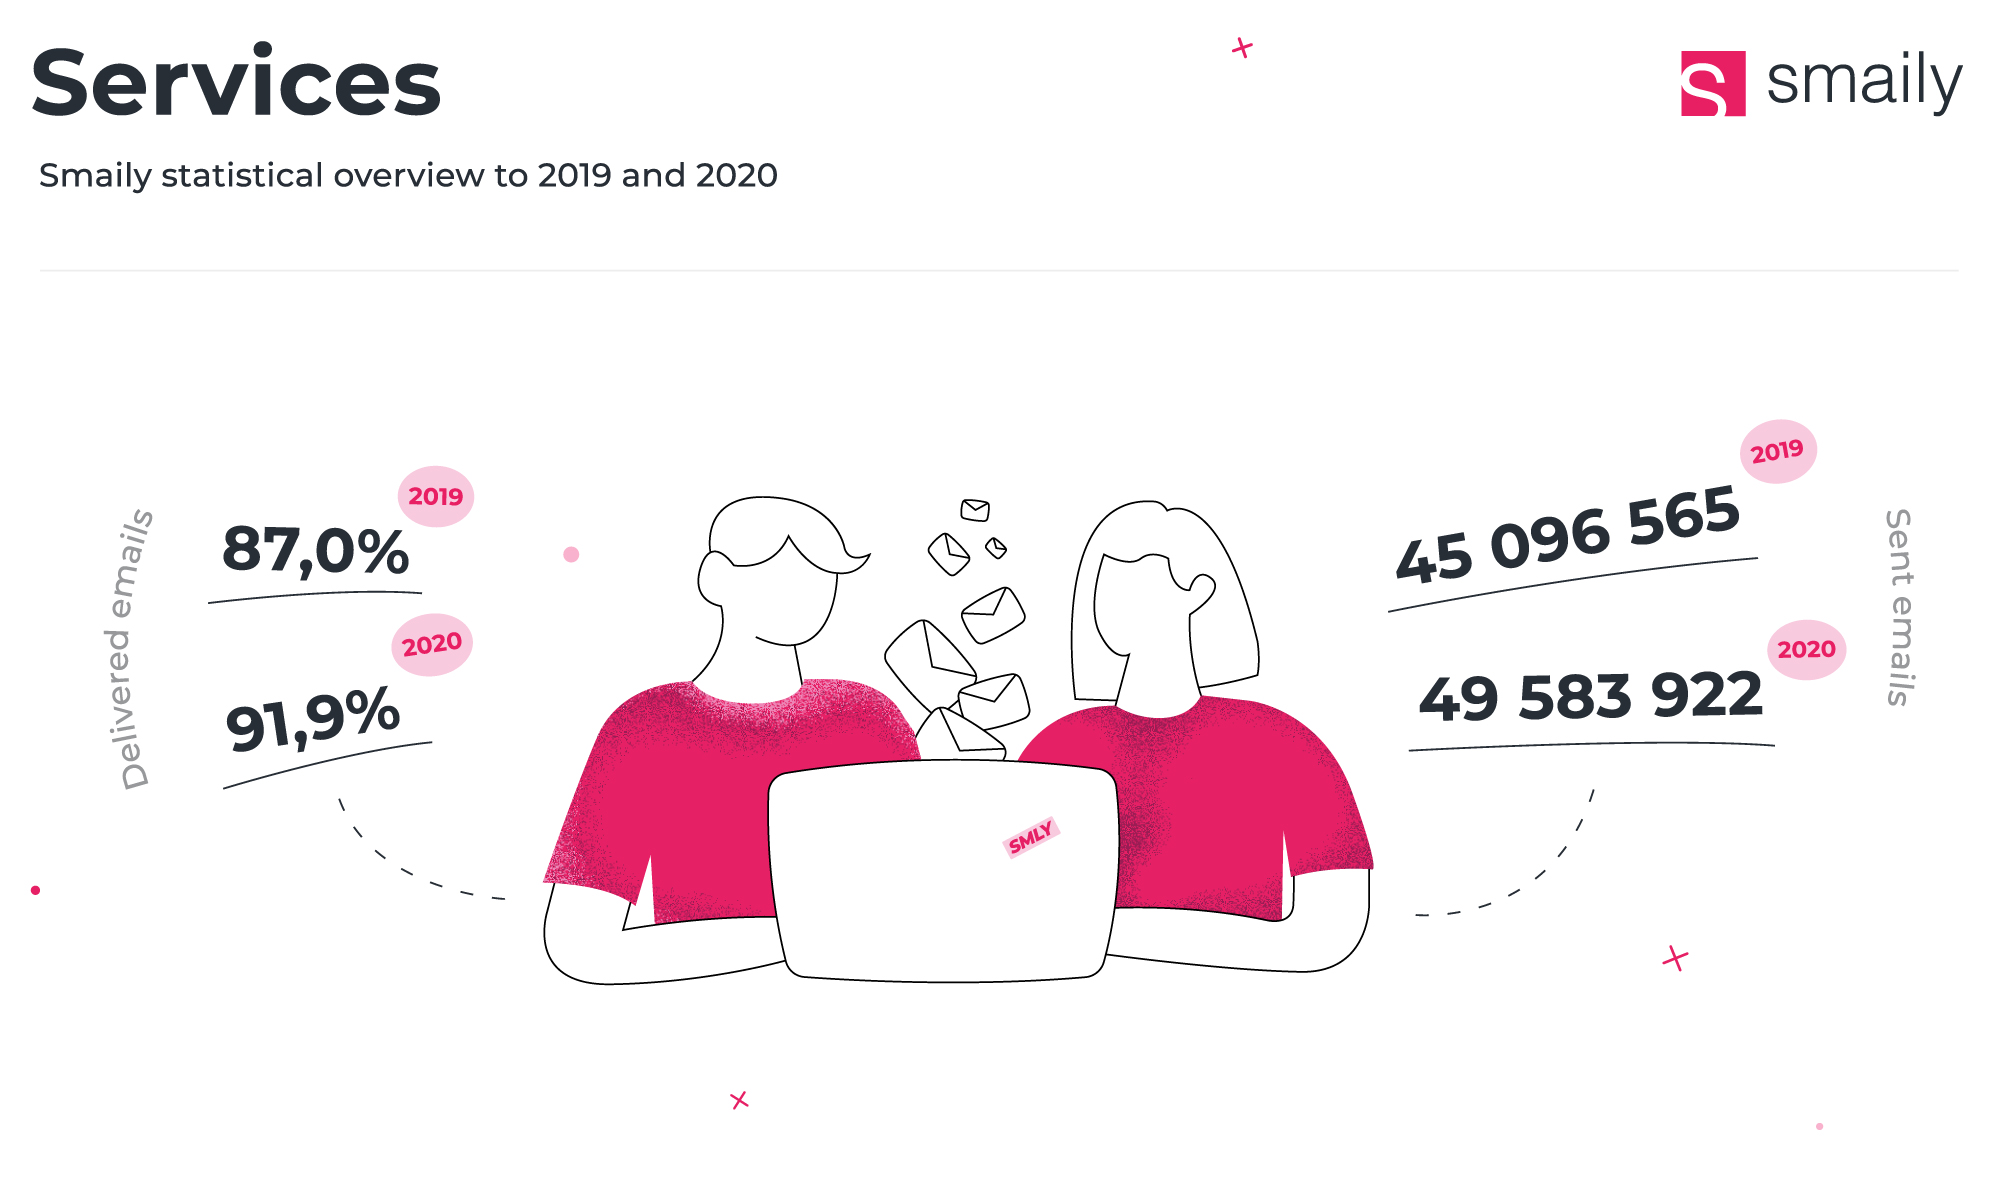
Smaily is the most popular platform for sending out emails in Estonia – just within 2019-2020; we sent out more than 2 billion emails. Throughout the years, we have gathered statistics from different fields, and now we will share them with you as well. So below, you will find info about the most important statistics that every email marketer should watch. You can compare yourself to the average numbers in your field. PS, all the statistics are weighted averages, so the list size or brand reputation does not have an effect.
What data did we collect from these email marketing campaigns?
Firstly, let’s start by looking at the collected data and the meaning behind those numbers.
We collected the following statistics:
Open rate
Click rate
Open-to-click rate
Bounce
Complaints
Unsubscribes
All those above give important and valuable insight into your email marketing campaigns and your sender reputation (though there are more indicators to measure reputation). It is essential to look at each number individually and see how the numbers interact with each other. It is good to keep the numbers on a more or less stable level once you have already reached the full potential of your account. That means if you have reached a position where you regularly send campaigns, and your list is steadily growing, you should carefully monitor every sudden increase or decrease in numbers.
For example, if you suddenly have massive open rates growth, it is an excellent sign. However, suppose you see a sudden drop in the open rate. In that case, you should also look at bounces, complaints, and unsubscribes – it is possible, for example, that the drop in open rates was caused by a large number of bounced emails, which was caused by adding a lot of new email addresses to the list. So in that scenario, it does not mean that the campaign, in general, was bad. You should just clean the list.
Now, let’s have a look at each of those statistics:
Open rate
This is the so-called well-being statistic, simply because once you have hit that “Send” button, you will immediately start seeing an increase in the open rate, which makes every marketer happy. With Smaily, you will see the open rates (also click rates) throughout time for each campaign.
The rule of thumb is that 80% of the openings happen within the first 24 hours after sending email marketing campaigns. And most of them occur within the first hour. So you can already predict the campaign’s results one hour after the send-out, and either the campaign is more or less successful than your average campaign.
How is it possible to measure the open rate? Well, Smaily will place a tiny pixel into your email – you cannot see it anywhere, but once the email has been opened, the pixel will be downloaded, and that is how Smaily knows that the recipient has read the email.
Total Opens and Unique Opens
You can see two numbers regarding open rates. There are total opens and unique opens. In the overall statistics, Smaily will show you unique opens: both count and percentage-wise. If you are interested in seeing the total number of opens together with the count of how many times each individual has opened the email, then move to the tab “Opened” in the statistics view. You can also download the statistics from that tab.
Usually, it is essential to keep an eye on unique open numbers because then you will know how many people from your list were interested in your email. Sometimes, though, you might also want to retarget those who have opened your email many times but have not completed a purchase – that might indicate that they need a bit more convincing before they are ready to buy.
What is the open rate affected by?
The open rate is mainly affected by the subject line (together with the preheader) and the sender’s name. Your subject line should be appealing enough to make the reader curious so that they want to read the whole email. It is crucial to test different subject lines and see which ones are the best for your audience. Regarding the sender’s name – familiar names usually bring more opens.
If you are curious to know our suggestions about standing out in the inbox, then check out our article on better subject lines.
Click rate
If we use the terms of sales tactics, the open rate is like a warm lead, whereas clicker is a hot lead. Suppose a recipient opens the email, reads it, and also clicks on the link; they are more likely to purchase something on your website as well. It does not have to be a purchase. A click can also mean getting in touch or reading a blog post, giving feedback, or other activities.
Click rate is technically counted with a redirect: each link in your email firstly leads to Smaily, and from there, the recipient is redirected to the actual link. That ensures a very accurate count of clicks for statistics.
Total Clicks and Unique Clicks
You can see two numbers for clicks (same as for opens) – total clicks and unique clicks. The difference between the two of these is that there are always recipients who click on the link more than once. So total click rate takes all the clicks into consideration, while the unique click rate only counts each recipient once. That is the reason why the unique click rate is always lower than the total click rate. In overall statistics, Smaily shows you the unique click rate. If you want to see the total clicks number, check out the tab “Links.” You can also check which email address has clicked the most and download the statistics about clicks from that tab.
What is the Click Rate Affected By?
Click rate is mainly affected by the content of the email. Suppose the goal of a subject line is to create curiosity in the recipient. In that case the content of the email should motivate the recipient to follow the link provided in the email and even convince them to make a purchase.
Of course, not all emails are meant to make people buy things. It is very common (especially if selling a service) to introduce an offer, and at the end of an email, just ask for a reply or offer to book a call.
If you are sending a traditional newsletter, then the goal is to talk about each blog bost just enough that the reader would want to click and read the full article.
The Effect of Imagery and Structure
The structure and visuals of email are topics that make email marketers argue a lot. The most important thing about it is to remain true to your brand. If your brand is known for fancy visuals, pictures, and different design elements, then use the same tactics in email. Probably your followers are used to that, and they will get a familiar feeling if the visuals are similar on your website and in email.
But if your recipients follow you for full-length blog posts packed with lots of helpful information, then adding huge background pictures might even disturb them. And if you need some inspiration about email designs, then here are some examples.
Open-to-click rate
Unique click rate is calculated as a percentage of unique clickers from delivered emails. On the other hand, open-to-click rate will tell you how many openers also clicked on some link in the email. So this is a statistic to measure how many recipients moved into the next step in your marketing funnel.
Bounces
Your emails can bounce for many reasons, mainly because the email address was faulty (usually a spelling mistake), the mailbox was full, or there was a connection error. Bounces can be soft or hard. A soft bounce is a temporary error, and in that case, the server will try to send the email again. A hard bounce is, for example, an incorrectly written email address, and in that case, that mailbox cannot be found. In that case, the email is returned to the sender, and it will not be sent again.
Bounce Rate
The bounce rate is another metric to observe by any marketer. It is natural, that customers make spelling mistakes while filling out subscription forms. Also, technical errors can occur. But if your email marketing campaigns have a constant bounce rate of more than 5%, it is time to clean your list. It could mean, for example, that your website is being attacked by robots, and therefore, you have a lot of non-existing email addresses in your mailing list. A high bounce rate could also indicate that the list you are using is bought, as usually these lists contain vast amounts of non-existent addresses.
Once your account has reached some kind of maturity, some occasional bounces do not affect it anymore, and your average bounce rate will probably stay below 1%. It might jump up once you have added a considerable amount of new emails to your list and the time period between two campaigns is long. Also, the bounce rate tends to be higher on automatic email marketing campaigns that are sent to new signups (for example, welcome letters about joining the list).
In any case, it is always recommended to maintain good list hygiene and occasionally delete the bouncing emails from your list as they are no good to your sales either. Also, the more active list you have, the better sender reputation you have. Smaily will not try to resend emails to contacts who have bounced already several times, but they still count towards the number of planned campaign recipients. So excluding bounces from your list will also give you higher open and click rates.
Complaints
This shows the number of recipients who marked your email as spam. You would want to keep that number as small as possible. If your newsletter does get an unusually high number of complaints, then look at the message and style of communication. Maybe there was some mistake, and it was offensive or disturbing to some of your followers? Also, this statistic tends to be high if you did not ask permission from the recipient to send them newsletters (i.e., the list has been bought).
This statistic has a massive impact on your sender’s reputation. If the number of complaints increases rapidly, there is a big chance that email service providers will start placing your emails into the spam folders.
Unsubscribes
These statistics show the number of people who have shown interest in not receiving newsletters from you anymore. First, let us mention that the unsubscribe link must be included in every single email. Please notice that although this number should not be very high, it is very natural that all your newsletters will have some unsubscribers, which is healthy. There are clients on every list who have been there for a long time, and it is only natural that they no longer have an interest in the product/service you are offering. Also, it is so much more healthy to let those people leave the list as otherwise, they might end up complaining about your letters, which is often worse.
Unsubscribe rate
The unsubscribe rate is an important metric to look at while deciding the success of your campaign – once your mailing list is big enough, it should have some unsubscribers with each campaign. Let’s say that you have about 6000 subscribers, and with each newsletter, you have 5 unsubscribers. Now, the next campaign you send out has 0 unsubscribers.
That means that you should immediately look at other statistics as well – if there has also been a drop in open and click rate, it might indicate that you have deliverability issues (domain being reported to spam lists or something similar). But if the other statistics remain at their standard rate, you can celebrate because you have simply created a very successful campaign!
What are the tactics for improving the statistics of email marketing campaigns?
Clean the list!
Successful email marketing campaigns have an open rate of at least 20%. If it is below 20%, it does not indicate that this is a bad campaign but most probably your campaign has been sent to all the contacts in the list, including bounced emails and contacts who have never interacted with any of your campaigns. Therefore, cleaning up your mailing list is an effective and easy way to pump up your open and click rates. By reducing the number of inactive clients, those statistics will get higher!
So, first step, delete bouncing contacts. Second step, filter the contacts who have been on your list for at least a year and never opened any of your emails (if you send campaigns very frequently, like once a week, then 1 year might even be a too long time) and exclude them from your next send-out. Then compare this campaign to the previous ones, and you will see so much better results!
Segmentation and personalization
Segmenting and personalizing were briefly mentioned under cleaning. You should send your newsletters to active recipients. And if you want to dive deeper, notice that your subscribers might be interested in different things. So try to approach them also differently by sending different messages to other target groups. For example, try other subject lines for male and female contacts. Or add emojis to younger subscribers and non-emoji subject lines for older. The number of varying segmentation types is endless! Just remember, the more personal messages you deliver, the more successful email marketing campaigns you will have!
Test!
A/B testing should be an essential part of your email activity. Even the best copywriter in the world does not fully know what the recipients prefer, so it always makes sense to try out different subject lines and then send the most successful version to the list. You should also test the text and color of CTA buttons, different design elements, texts, and other things in your email. Making an A/B test is so easy with Smaily – just select the A/B test as campaign type, follow the instructions, and you can set up the test within minutes!
Need some examples?
If you want to increase your open rates, then follow state institutions, telecom, cars and transportation, and insurance companies as they have the highest open rates on average. Pay attention to the subject lines and think about their brand reputation – people tend to open emails that are necessary for them (like email about an expiring ID card or bill for mobile services) and also emails from brands that are very well known.
The highest click rate is among real estate, cars and transportation, telecom, gambling, and state institutions. Follow some of them and pay attention to the email content and how they manage to motivate subscribers to click on the links. Again, emails with links to pay the invoice will probably get people to click. Also, many of these companies are excellent at segmentation – if you can deliver the right message at the right time to the right customer, then you have nailed the road to success!
Want to know more about improving your email marketing campaigns?
We have written many blog posts about topics like how to increase your open rate and click rate. You might want to read also:
How Deliverability Works in Email Marketing and What Can You Do to Improve It
Create Error-Free Emails: Most Common Email Marketing Mistakes
Email Copywriting Tips: How to Write Great Email Content
Understand your Target Customers with these Email Marketing Analytics Tactics
About the Authors
This article was made in co-operation with Viivika Lumberg and Smaily based on joint views of the email marketing field. Viivika Lumberg is the founder and owner of the e-mail marketing agency Maildo OÜ. Viivika has been operating in the marketing landscape for over 15 years, of which the last few years have focused mainly on e-mail. Smaily, an email marketing leader in Estonia and on the shortlist in the Baltics and Scandinavia, has provided statistics and methods for this research. Having been on the market for the past 15 years, Smaily’s mission is to offer simple and visually beautiful tools for newsletters.
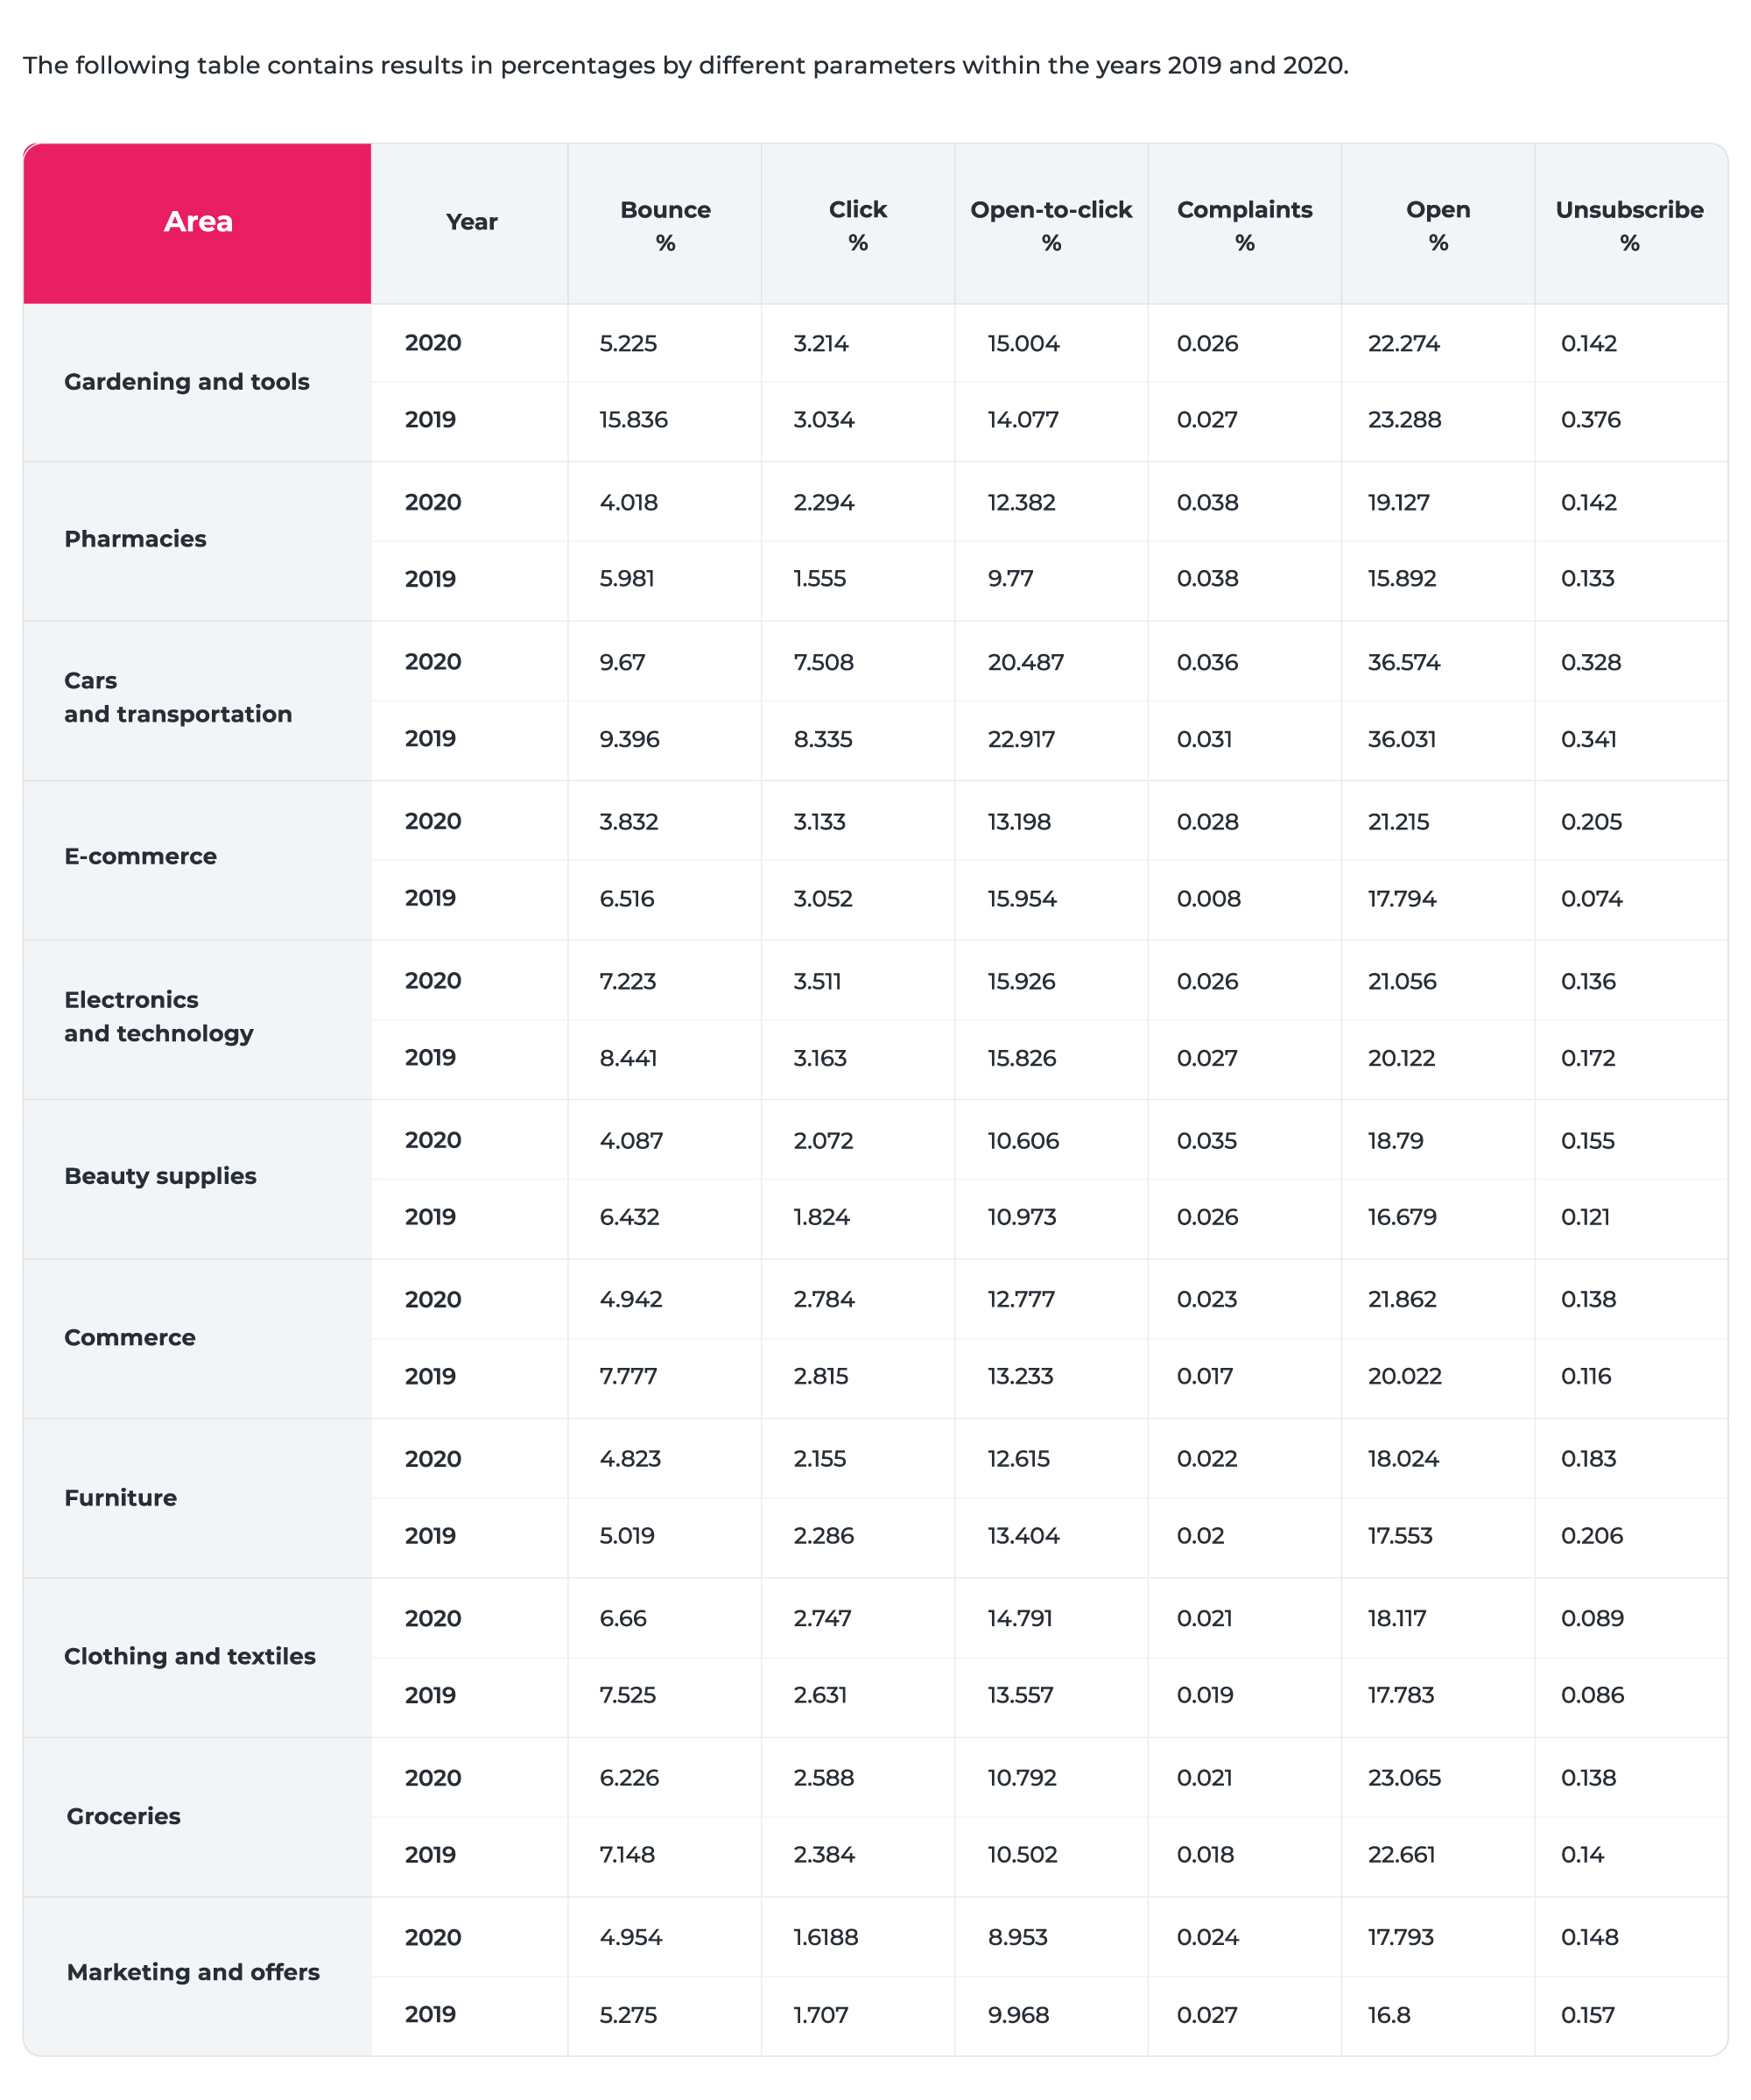
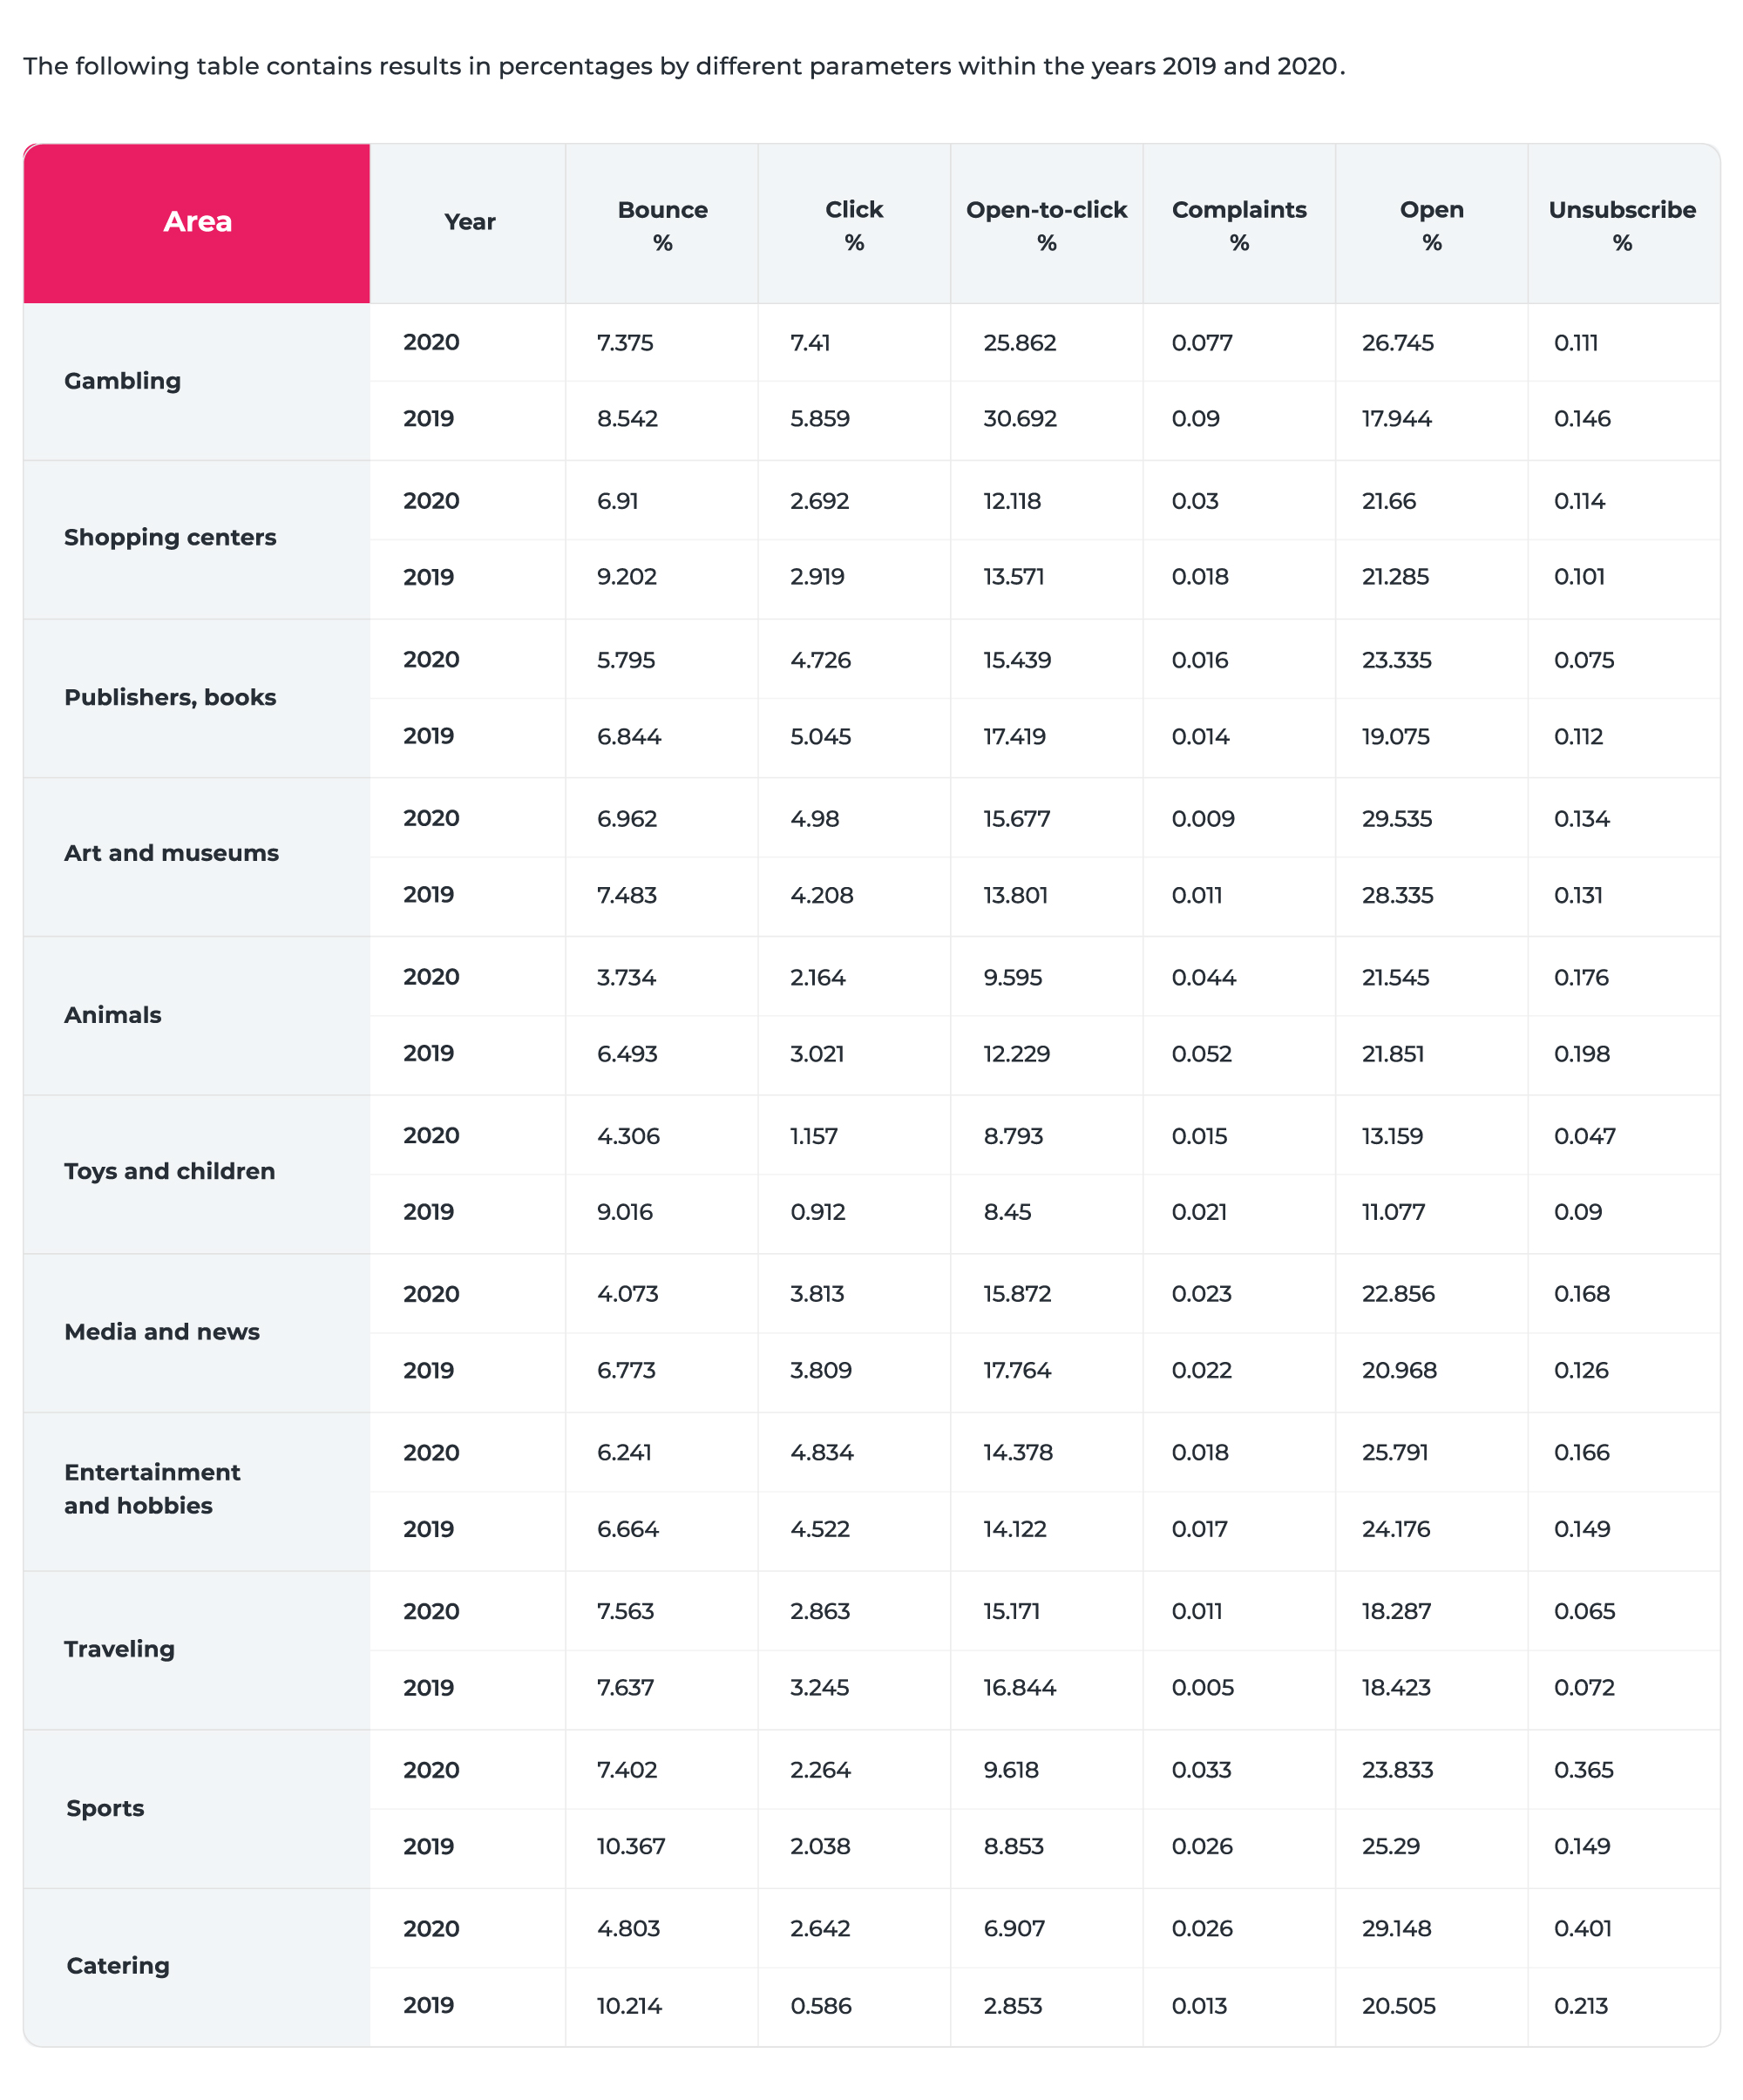
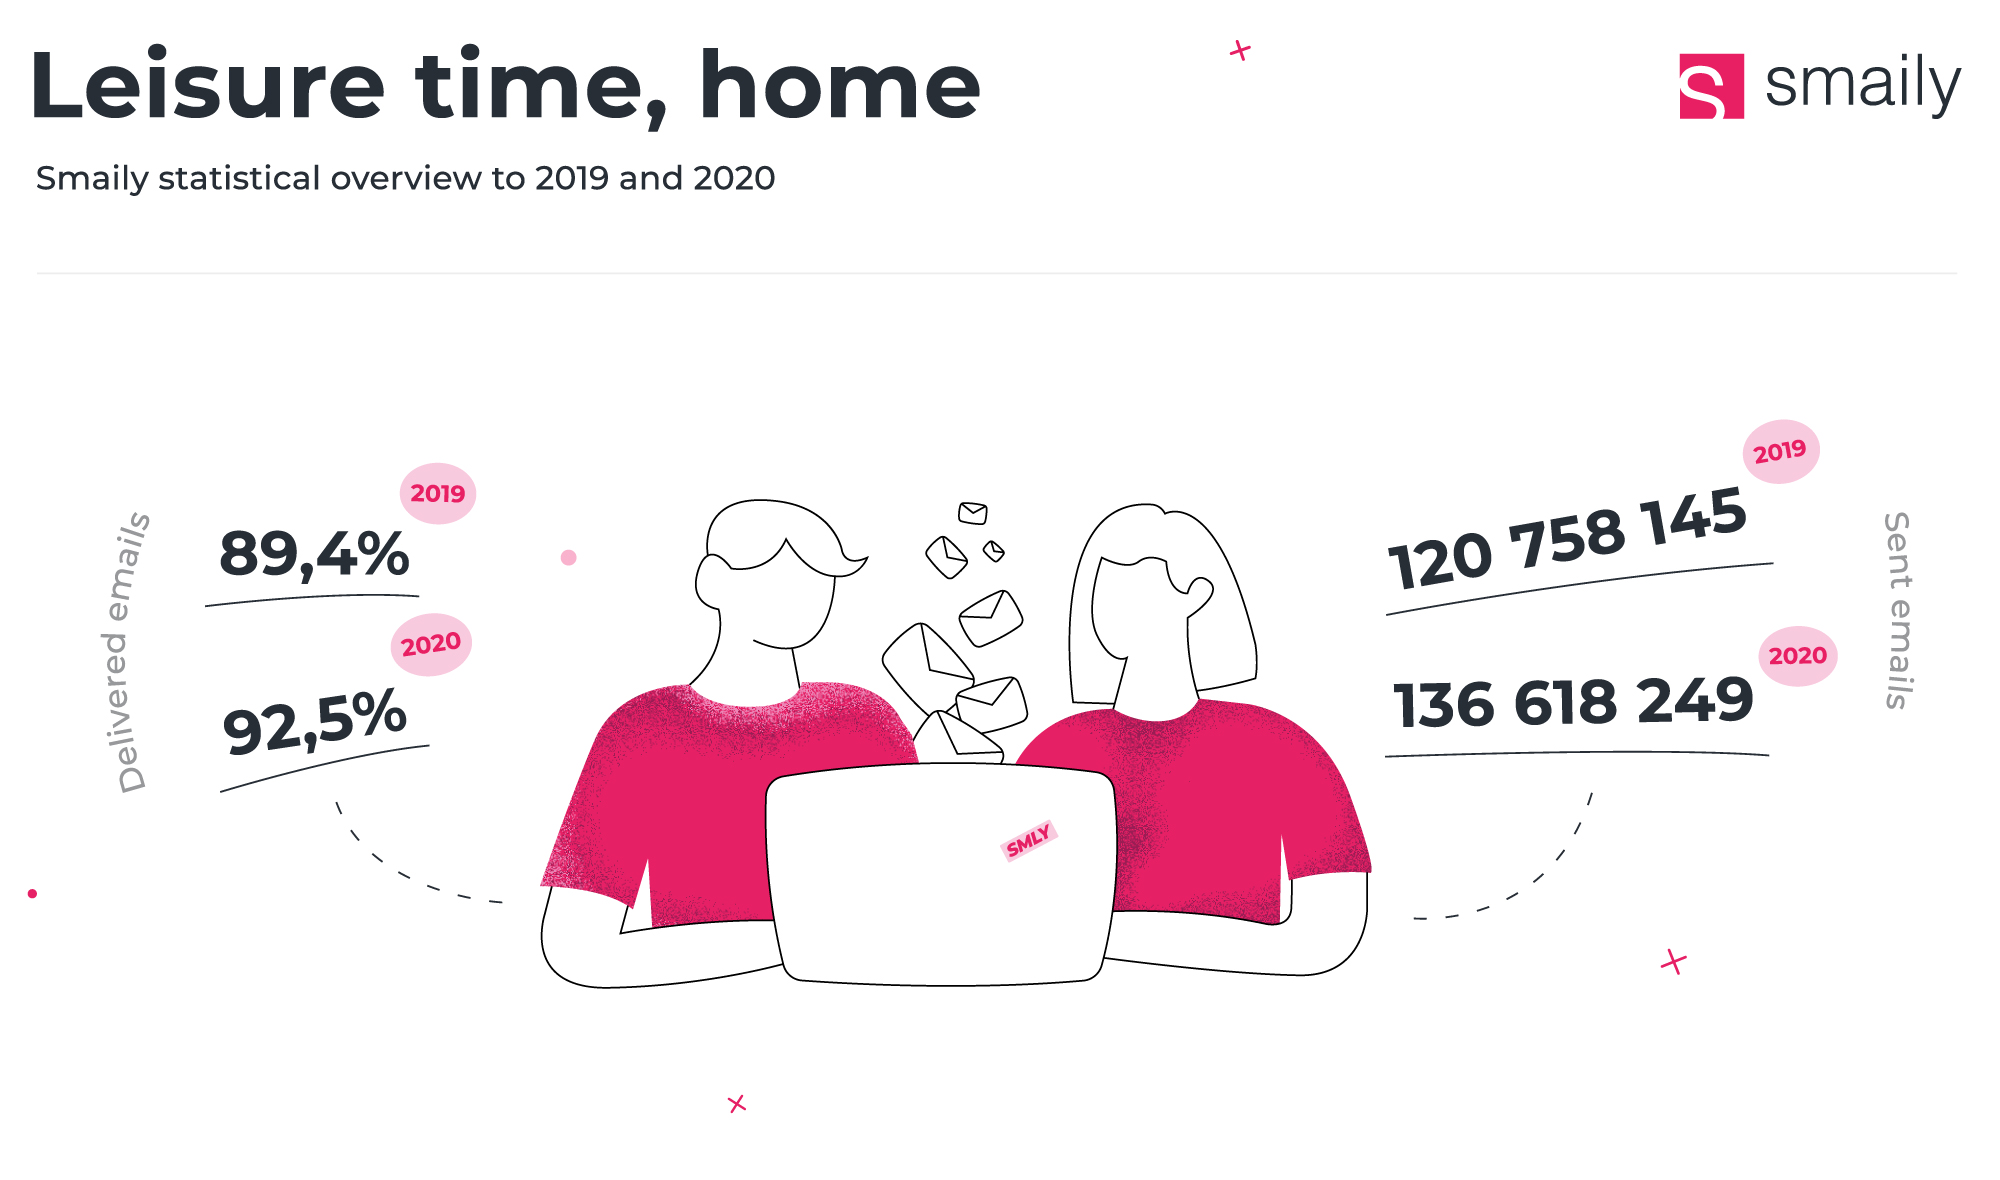
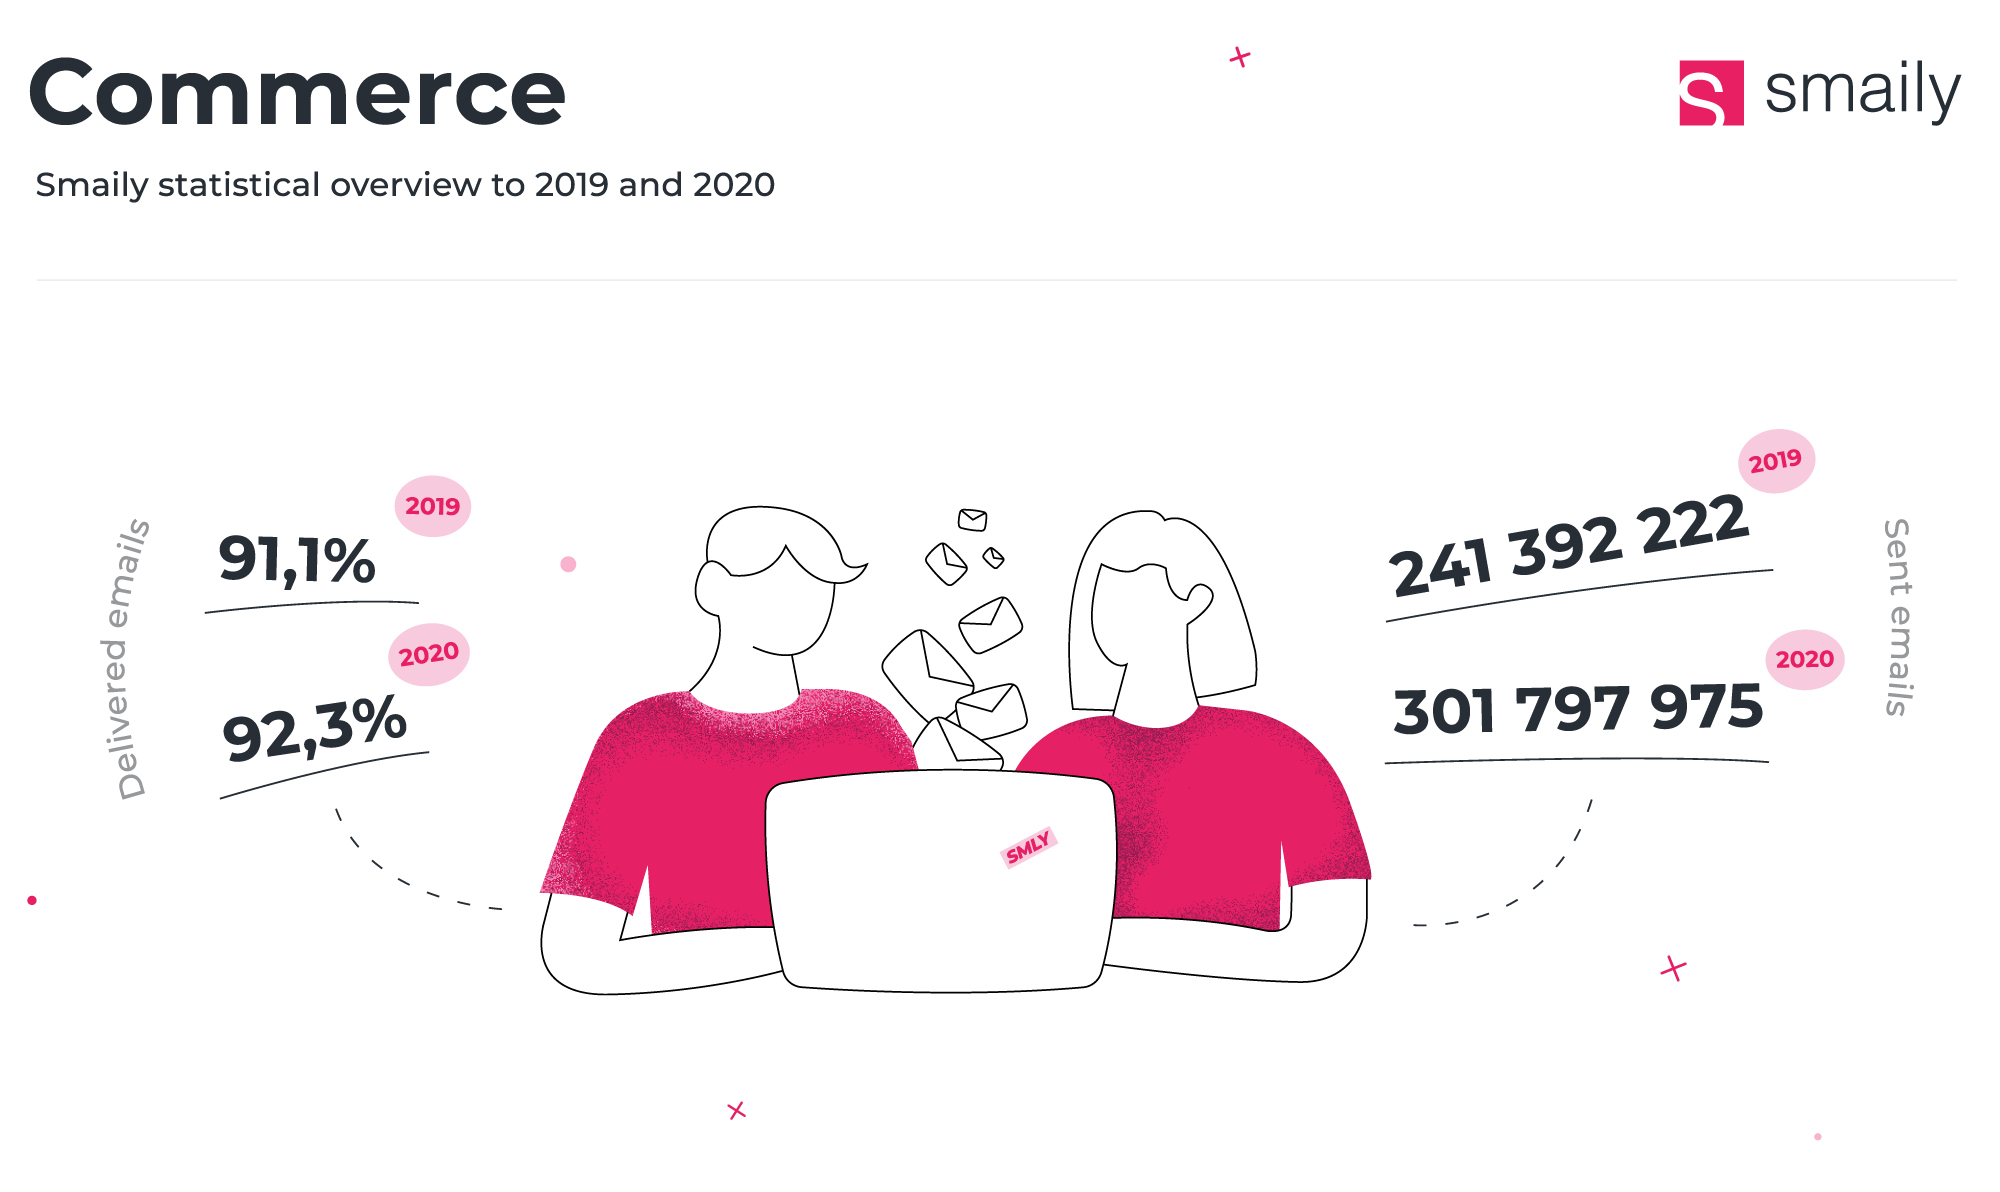
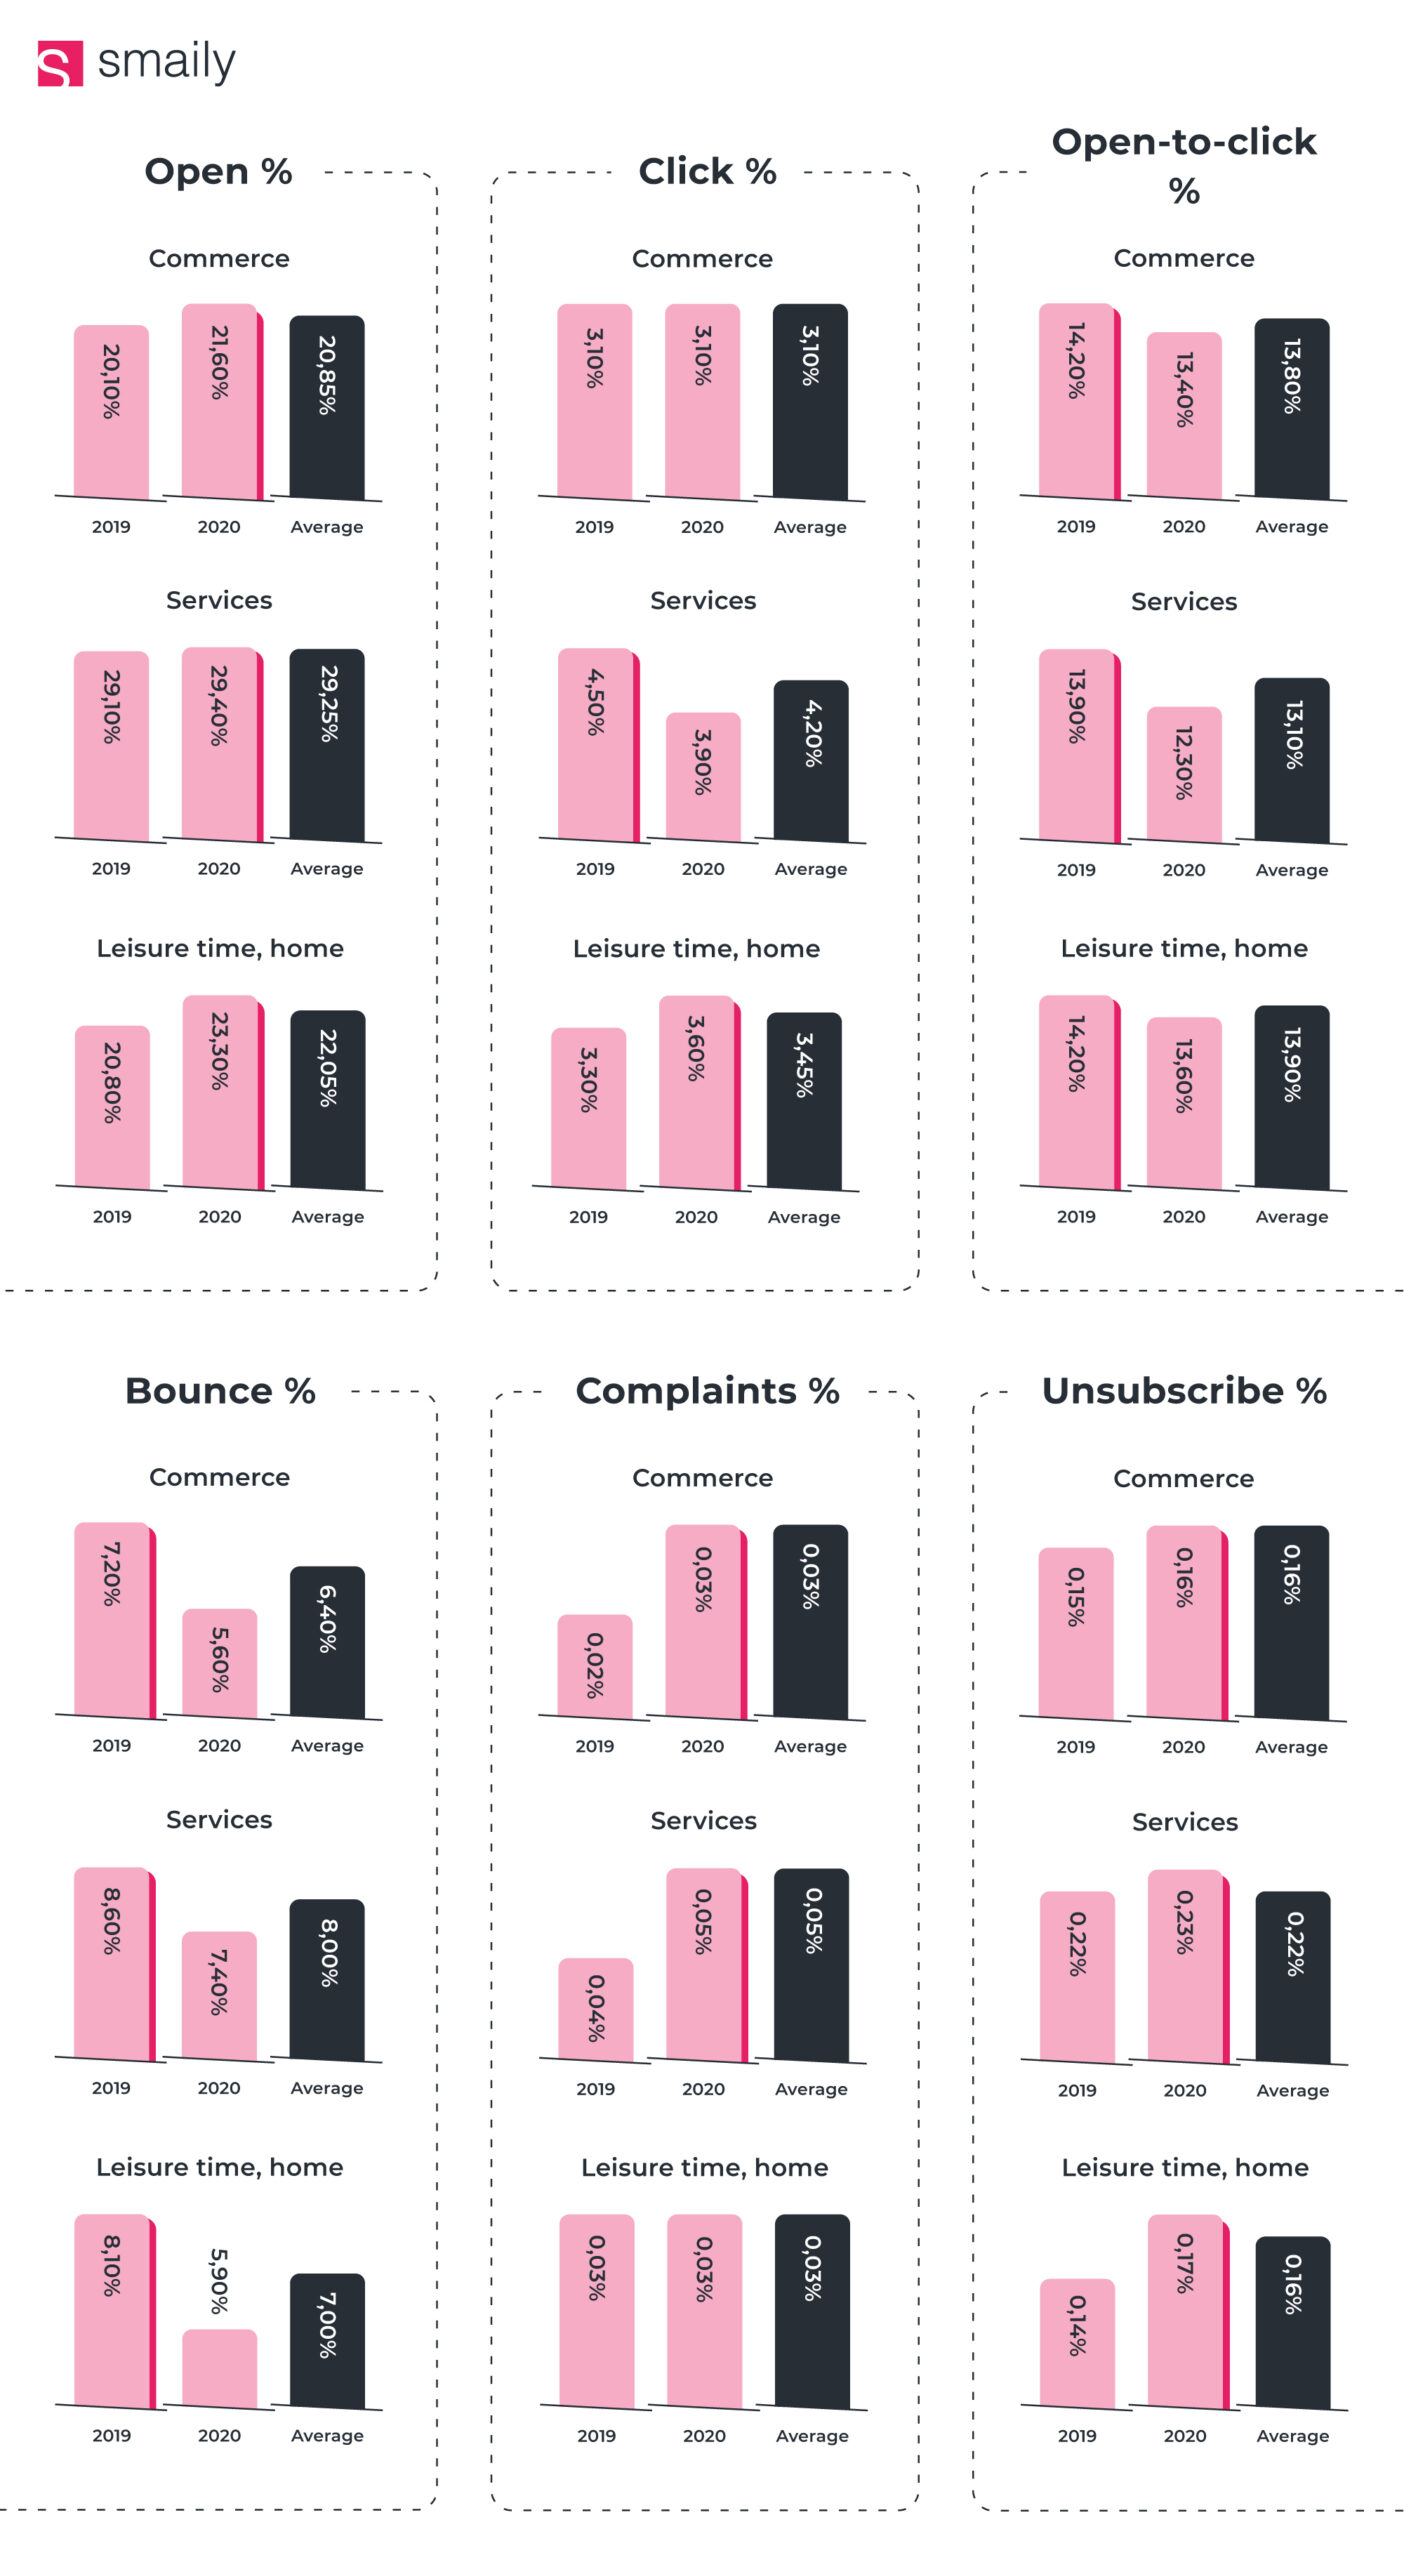
Here is a close-up of statistics with commerce, services, and leisure time. Click on the image to zoom in.